
What is skills visualization and why does it matter?
kills visualization is turning raw skill data into something you can actually read at a glance. Instead of scanning rows and columns to figure out where your gaps are, you see them instantly in heatmaps, charts, and comparison views.
A skills matrix tells you what data to collect. Skills visualization tells you what that data actually means.
Most teams stop at the matrix. They build the spreadsheet, fill in the ratings, and call it done. But a grid of numbers doesn't answer the questions that matter: Which skills are we losing? Where should we invest in training? Who's ready for a bigger role?
That's where skills mapping software comes in. It takes the same data a spreadsheet holds and makes it visible, so you spot patterns instead of hunting through cells.
What skills mapping software shows you that spreadsheets can't
A spreadsheet can hold the same data. Names in rows, skills in columns, ratings in cells. But that's where it stops. Skills mapping software takes that same data and makes it work for you. Here's what that looks like in practice.
Side-by-side skill comparisons with context
Need to staff a project or build a new team? In a spreadsheet, you'd scroll through rows of names and mentally compare numbers. Skills mapping software lets you pull up people side by side, see their proficiency levels color-coded at a glance, and spot who meets the bar and who doesn't. No formulas. No squinting at cells.
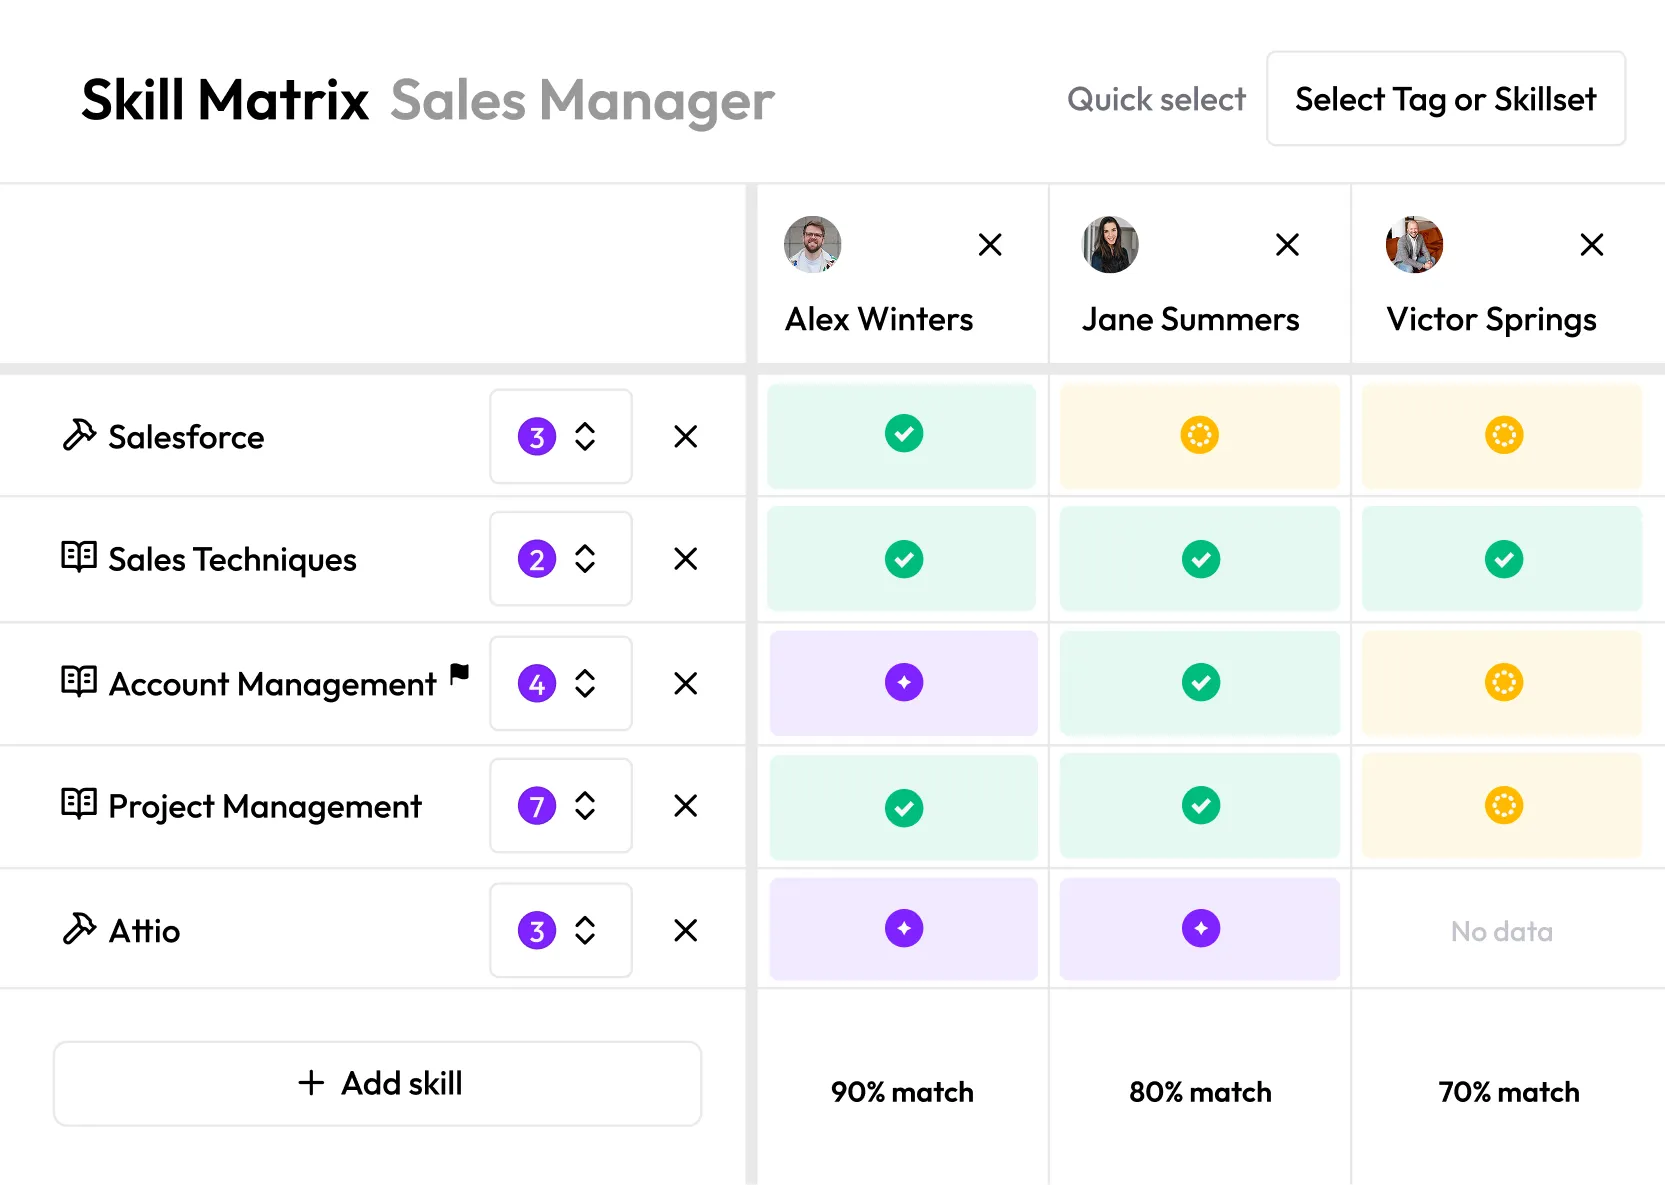
Match percentages that answer the question instantly
When you're choosing between candidates for a role or project, you don't need to see every individual skill rating first. You need to know: who's the closest fit? Skills mapping software calculates an overall match percentage so you can see that Sharon is a 91% fit and Channy is at 68% before you dig into the details.
Drill-down details without leaving the view
A spreadsheet cell shows you a number. That's it. If you want context, like what training someone completed, how they were assessed, or who rated them, you need a separate document. In skills mapping software, you click a cell and the full picture opens up: assessment history, manager notes, evidence. The overview and the detail live in the same place.
Skill categories that organize the mess
Spreadsheets treat every skill as a flat list. Skills mapping software groups them by category, like hard skills, soft skills, languages, or certifications. That structure makes it easier to scan, compare, and decide, especially when you're looking at fifteen or more skills per person.
Spreadsheet vs skills mapping software: a honest comparison
Spreadsheets aren't bad. They're where most teams start and they work fine for a while. But there's a point where they stop being helpful and start creating extra work. Here's where that line is.
A spreadsheet is a storage tool. It holds data. Skills mapping software is a decision tool. It helps you act on that data.
If your team is under 20 people and you're tracking fewer than 10 skills, a spreadsheet is fine. Once you go beyond that, the manual work starts eating more time than the tracking saves.
What to look for in skills mapping software
There are plenty of tools that claim to do skills mapping. But most are either full HR platforms with a skills module bolted on, or simple spreadsheet replacements that don't add much. Here's what actually matters when you're choosing.
Start with how you'll use it, not what it can do. Before you compare feature lists, get clear on your actual use case. Are you trying to staff projects faster? Identify training needs? Plan for succession? The right tool depends on the question you're trying to answer.
Look for visual comparisons, not just data storage. If the tool just gives you another grid of numbers, you haven't gained much over a spreadsheet. You want to see people compared side by side, with clear indicators of who fits and who doesn't. Match percentages, color-coded proficiency, categories that group skills logically. The output should answer your question at a glance.
Check who has to do the work. Some tools put all the burden on HR to input and maintain everything. Others let managers and employees contribute directly. The less manual admin work required, the more likely your data stays current. Ask: who updates skill levels, and how often does that realistically happen?
Think about your team size. A tool that works for 15 people might fall apart at 150. Make sure it handles filtering by team, department, or location. If you're growing, you want something that won't need replacing in twelve months.
Don't overpay for features you won't use. Enterprise HR suites often include skills mapping as one module inside a massive platform. If all you need is skills visibility and team comparisons, you don't need to buy a system that also handles payroll, time tracking, and performance reviews. Look for tools that do skills mapping well without forcing you into a full platform commitment.
Your skills data is already there. Make it visible.
Most teams already track skills in some form. The data exists. It's sitting in a spreadsheet somewhere, half-updated, shared across too many versions, opened once a quarter if at all.
The problem was never collecting the data. It's that a spreadsheet can't show you what it means. You can't glance at a spreadsheet and know who's ready for a new role, which team has the biggest gaps, or where your training budget will have the most impact.
That's what skills mapping software solves. Not by replacing your spreadsheet with another grid, but by turning the data you already have into something you can actually use to make decisions.
If you're ready to see what that looks like, explore Everday's skills matrix, it's free to start and takes minutes, not months, to set up.
Stop building skill gap analyses in spreadsheets
Everday maps your entire organization's skills in hours and shows you exactly where the gaps are.
Free for 14 days, no credit card needed.

Get your entire company's skill matrix
Everday's AI-powered skills mapping builds your company's skills matrix faster, and with greater accuracy than creating it manually with the traditional spreadsheets.

14 day free trial, no credit card needed